15 Helpful Flash Components to Make Charts and Maps
15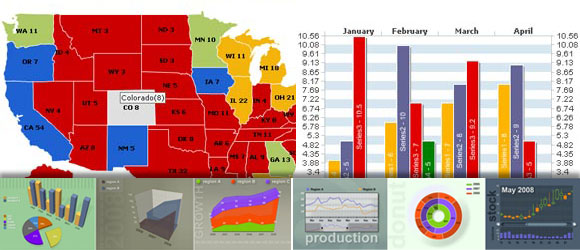
Flash components allow you to create easily applications or add functions to you site with no much hard coding or developing process.
The charts and maps Flash components are very famous and most wanted components to allow you to add static and analytics to your website. The below resources give you variety of styles and shapes for interactive charts and maps.
Fly Charts
FlyCharts is a new version (2.0) of flash charts component. The second version brings you more ways to visualize your data, much more rich and customizable interface, fast and easy tuning of your component. And please note – it’s still free for private persons, still tiny and fast!
Generally FlyCharts is a set of Adobe Flash (SWF) files that gives you outstanding possibility to visualize your data. Now, using FlyCharts you can create compact, interactive and good-looking charts in a minute.
FlyCharts doesn’t need any installation, works with any scripting language, can be used in any browser, is interactive, is scalable & flexible, size of output files is reallysmall. We have a number of chart types – column/bar, line/pipe, pie, area.
Fly Charts is available for free for private use only . And for Commercial-use and developer licenses You can buy a version with commercial license including support as well as component sources of the component on Buy page. Live Demo
zx Chart
zxChart – creates dynamic charts in the Macromedia Flash™ SWF format. Software based on the Macromedia Flash™ technology and may be used on any platform. Does not require knowledges of Macromedia Flash™. Data source may be static file or a script (PHP, ASP, Perl, etc.). Using scripts, You can select data from any database, files or devices. To build chart you must create Data File (static file or script), choose a Style File, and insert special code to your HTML page. Software supports following chart types: column, bar, pie, line, composite column. See The Live Demo
anychart
AnyChart is a flexible Adobe Flash based solution that allows you to create interactive and great looking flash charts and dashboards. It is a cross-browser and cross-platform charting solution intended for everybody who deals with creation of dashboard, reporting, analytics, statistical, financial or any other data visualization solutions.
AnyChart Features
Save chart as Image ,Correct printing with FireFox browser ,Multiple Axes,True Date/Time support,Logarithmic Scales,Axis positioning,Axis inversion,Interactive Gauges and Gauge Dashboards,Chart types and others.
Wide variety of Chart Types (most of the chart types are available in 2D and 3D) ,And also you can Download Free Trials And See The Live Demo
flabell
Simple, easy to use statistics chart, controlled by XML input. Everything is customizable, from speed of point movement to colors of strokes inside the points!
Features:
1. Customizable size.
2. Customizable colors for everything.
3. Customizable display of labels.
4. Customizable graph line thickness and dots size.
5. Supports unlimited information passed through XML.
6. Customizable description for each item.
Initializing a Chart on Stage
Similar to other Flash components, you can create a chart by placing an instance on the stage or by using ActionScript to create an instance dynamically.
here you can make an amazing flash chart component with simple steps to follow with yahoo flash developer center
Fusion Charts
FusionCharts v3 offers a wide variety of 2D/3D chart types. Click on any chart category below to see the charts in that section.
Apart from the charts in general suite, FusionCharts v3 also offers PowerCharts v3, FusionWidgets v3 and FusionMaps v3 for advanced charts, gauges and maps. Live Demo
oxylus flash
This is a graph component that illustrates the data from a XML file. You can add an unlimited number of entries and each bar can have its own color to easily distinguish between the important values and those less important. Sizes and spacing can be set in the XML file. It’s a flexible component giving you the possibility to specify the unit name. This way it can be used in variety of situations. Live Demo

Black boxchart
Black Box Chart is absolutely free.Just create an account and start downloading the release file, creating charts with the editor and using Black Box Chart wherever you want!
Black Box Chart goal is to be the fastest and easiest to use interactive web charting component.
am charts
AmCharts is a set of Flash charts for your websites and Web-based products. AmCharts can extract data from simple CSV or XML files, or they can read dynamic data generated with PHP, .NET, Java, Ruby on Rails, Perl, ColdFusion, and many other programming languages. Live Demo
Flash Pie Chart
There are many solutions to displaying charts on the web. Server-side reporting suites, client-side packages – you name it.
Sometimes however, all you need is a fast, easy and free method to display your data. This is what Flash Pie Chart provides
XML/SWF Charts
XML/SWF Charts is a simple, yet powerful tool to create attractive charts and graphs from XML data.
Create an XML source to describe a chart, then pass it to this tool’s flash file to generate the chart. The XML source can be prepared manually, or generated dynamically using any scripting language (PHP, ASP, CFML, Perl, etc.)
XML/SWF Charts makes the best of both the XML and SWF worlds. XML provides flexible data generation, and Flash provides the best graphic quality.
After previewing the above useful Flash components to create charts with different shapes and styles. In the following section, you will find Flash components to create world maps
Maps Flash Components
Here are some useful Flash components to create maps.
AnyMap
AnyMap Interactive Maps is a unique feature of AnyChart component that allows you to visualize geo related data.
Here are some tasks you can solve with AnyMap:
Create Drilldown Maps.
Create Geographical Related Dashboards.
Create Real Estate, Distributor, Franchise, Dealer, etc. locators.
Visualize statistical or reporting data easily.
Visualize marketing research reports.
Create Area Selectors for web-sites.
flash scope Map Component
developed by afcomponents this flash component shows a geographical position and airlines. Fully customizable design and ability to calculate longitude and latitude.
JC Flash Map
JC Flash Map is an Adobe Flash CS3/CS4 ActionScript 3.0 component used to display online maps from all of the major map providers: Google Maps, Yahoo! Maps, Microsoft Maps and OpenStreetMap. You can use the component to navigate through the map and pin down selected location with custom defined markers. This component can also be customized by you so you can fully integrate it in your applications and websites.
The component uses geographical coordinates defined as latitude and longitude to identify locations on the map. The latitude and longitude accept values only as decimal degrees, not as degrees, minutes and seconds.
The map can also be zoomed in or out, having a maximum zoom depending on the map provider.
FusionMaps
FusionMaps help you create animated, interactive and data-driven Flash Maps for your dynamic web applications. Using FusionMaps, you can display geographical data distributed by category, regions or entities. Ideal usage examples are statistical display of data, flight routes, office locations, election results, survey results or business data like “Revenue by Regions” or “Revenue by states”. FusionMaps does NOT work on zip codes or latitude/longitude.
The maps are driven by XML data source and can be integrated with any scripting language (ASP.NET, ASP, PHP, JSP, CF etc.) and database. Setting up a map barely takes a few minutes and doesn’t involve any modification of source code, even for resizing. You can directly customize each map using the XML API exposed by it. As such, you DO NOT need to know anything about Flash to use FusionMaps.
For more Flash charts and maps component check out:
Flash Components
Flash Components includes exclusive number of Flash components with high quality and web coded content.
Flash Loaded
In addition to the above charts and maps components, Flash Loaded includes more useful components with different styles.


[…] here to see the original: 15 Helpful Flash Components to Make Charts and Maps | Flash … By admin | category: asp script, scripts | tags: asp, build-chart, files-or-devices, php, […]
[…] http://www.graphicmania.net/15-helpful-flash-components-to-make-charts-and-maps/Using scripts, You can select data from any database, files or devices. To build chart you must create Data File (static file or script), choose a Style File, and insert special code to your HTML page. … Create Real Estate, Distributor, Franchise, Dealer, etc. locators. Visualize statistical or reporting data easily. Visualize marketing research reports. Create Area Selectors for web-sites. Live Demo cheap domstic flights from Alice Springs to Canberra 15 Helpful Flash Components to Make Charts and Maps … […]
[…] Read the original here: 15 Helpful Flash Components to Make Charts and Maps | Flash … […]
[…] post: 15 Helpful Flash Components to Make Charts and Maps | Flash … By admin | category: based software survey web | tags: asp, calls-on-china, china, […]
[…] the rest here: 15 Helpful Flash Components to Make Charts and Maps | Flash … […]
[…] http://www.graphicmania.net/15-helpful-flash-components-to-make-charts-and-maps/Using scripts, You can select data from any database, files or devices. To build chart you must create Data File (static file or script), choose a Style File, and insert special code to your HTML page. … Create Real Estate, Distributor, Franchise, Dealer, etc. locators. Visualize statistical or reporting data easily. Visualize marketing research reports. Create Area Selectors for web-sites. Live Demo 15 Helpful Flash Components to Make Charts and Maps … […]
Social comments and analytics for this post…
This post was mentioned on Twitter by allwebdesign: 15 Helpful Flash Components to Make Charts and Maps http://bit.ly/83SHHl…
[…] Data File (static file or script ), choose a Style File, …. Originally posted here: 15 Helpful Flash Components to Make Charts and Maps | Flash … Share and […]
[…] original here: 15 Helpful Flash Components to Make Charts and Maps | Flash … By admin | category: cms, flash cms | tags: amazing-showcase, cms, designing, flash, flash […]
Thanks for sharing
.-= Wallpaper´s last blog ..Up+in+the+Air+Movie =-.
[…] 15 Helpful Flash Components to Make Charts and Maps (graphicmania). Los componentes gráficos y mapas de Flash son muy famosos y los más buscados para que poder añadir estadísticas y análisis de datos en tu sitio web. Los recursos que presentan en el artículo nos permite darle variedad de estilos y formas para los gráficos interactivos y los mapas. […]
It would be great if you add our flex pivot table and charts – http://www.flexmonster.com
[…] is the original: 15 Helpful Flash Components to Make Charts and Maps | Flash … By admin | category: online software survey | tags: adobe-flash, charts, component, […]
15 Helpful Flash Components to Make Charts and Maps…
The charts and maps Flash components are very famous and most wanted components to allow you to add static and analytics to your website. The below resources give you variety of styles and shapes for interactive charts and maps….
[…] To see this useful charts and maps components please follow this link. […]