Amazing Examples of Infographics to Visualize You Ideas
0
Visualizing ideas through graphs and illustrations has proven to be an effective method to deliver information in an attractive way instead of the long boring ordinary tables.
The infographic illustrations try to provide statics about specific topic of interest in an illustrated method to allow users to know more about products and other topics that can be visualized. There are many styles for infographs based on vector illustrations, charts and bitmap real images.
The following collection include some different and infographic examples from different sources for data visualizations, and if you like this collection, you may like to check these informational designs too:
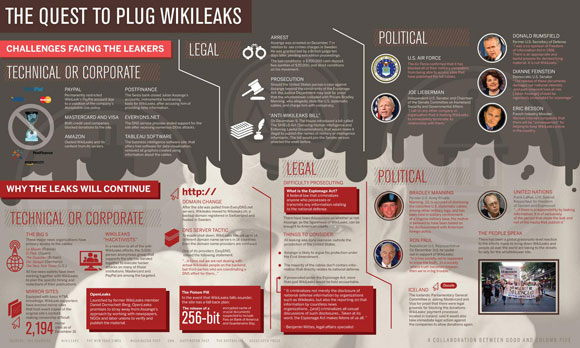
What’s Next for WikiLeaks?
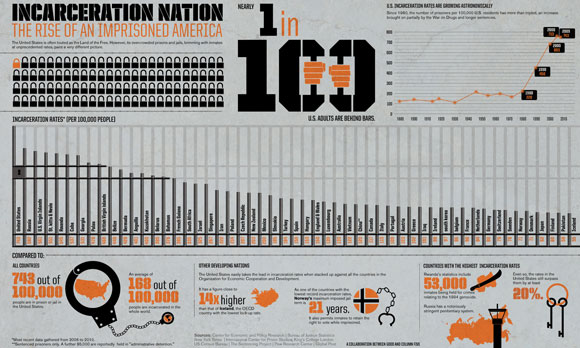
America’s Absurdly High Incarceration Rate
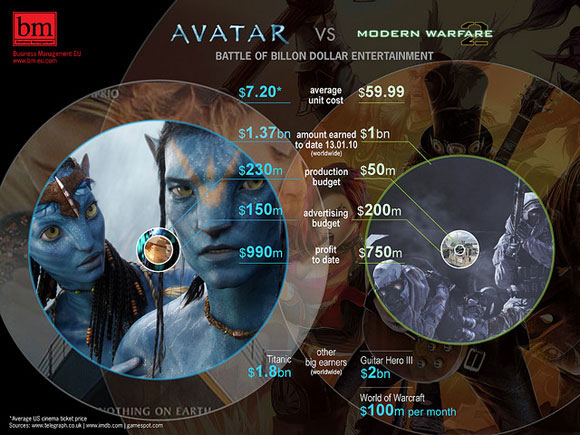
Avatar vs Modern Warfare
What you will do during your lifetime

US CEO Pay

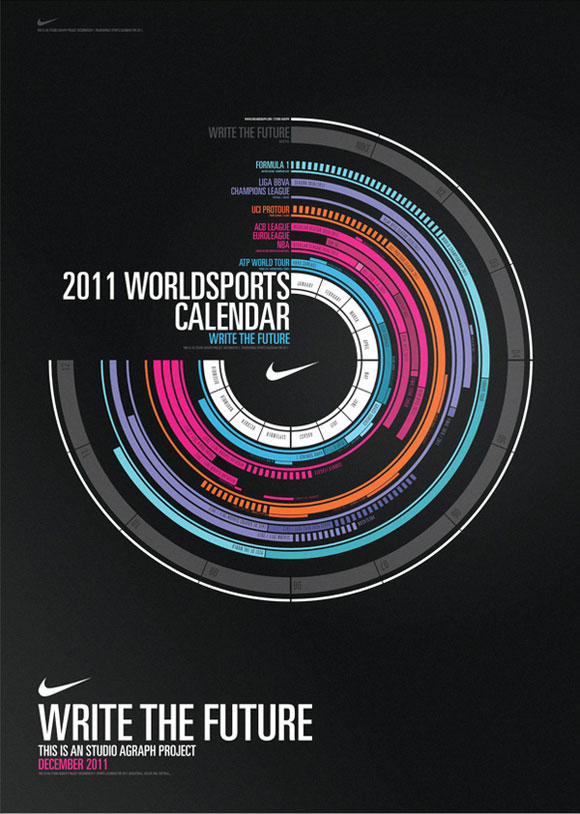
World Sports Calendar
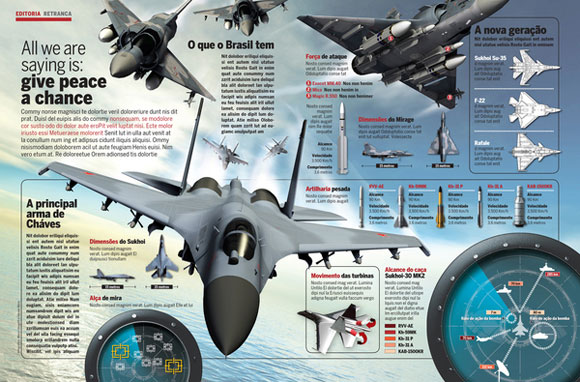
Infographic Space and Aviation
Worst Possible Ways to Die

The Number of Human Traffic

Infographic: For the Troops

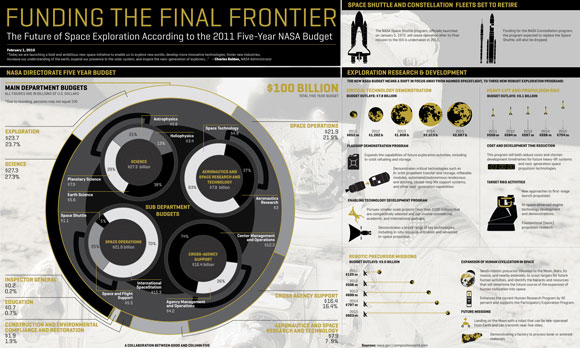
Transparency: The Future of NASA
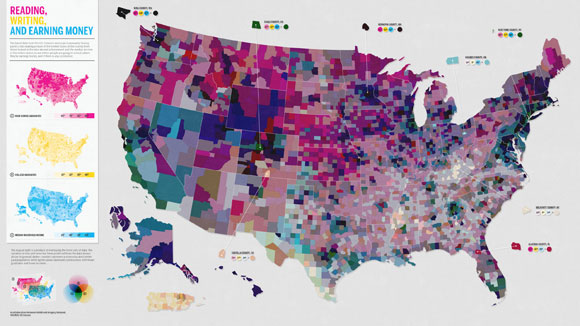
Are the Richest Americans Also the Best Educated?
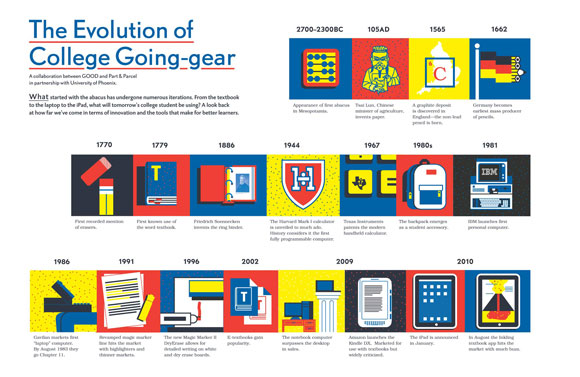
The Evolution of College-going Gear
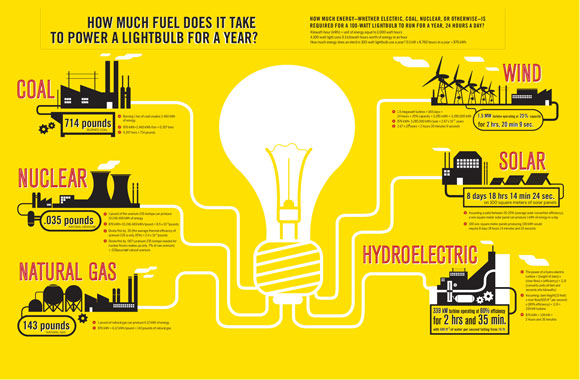
What Is the Easiest Way to Power a Lightbulb
Burj Dubai

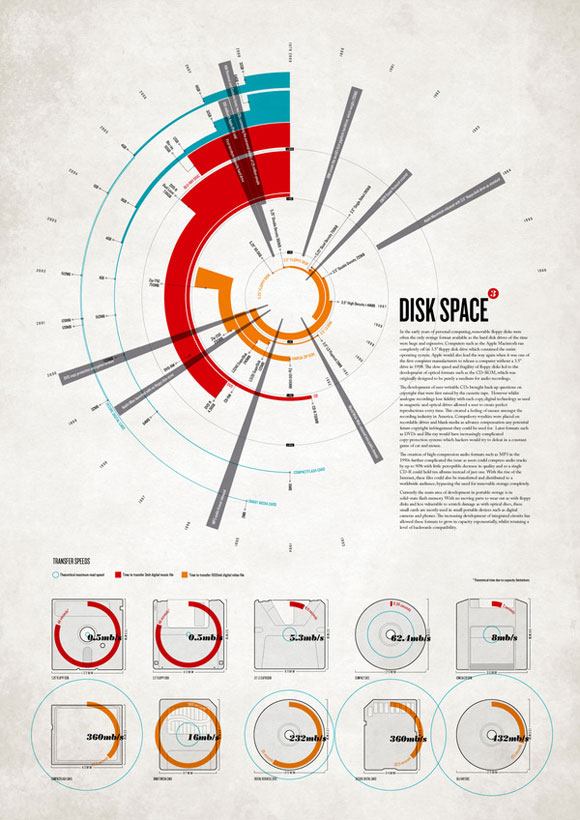
Disk Space Infographic
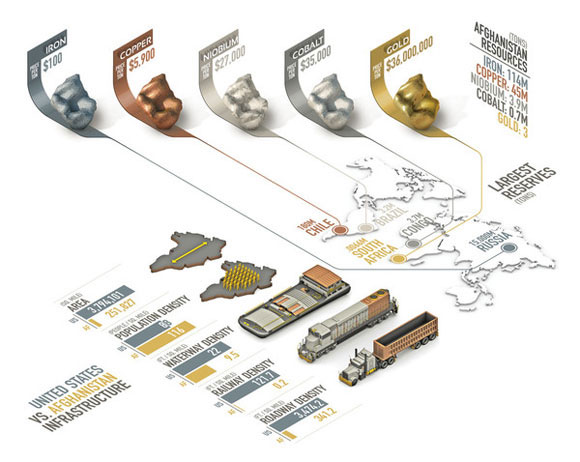
Afghanistan Resources Infographic
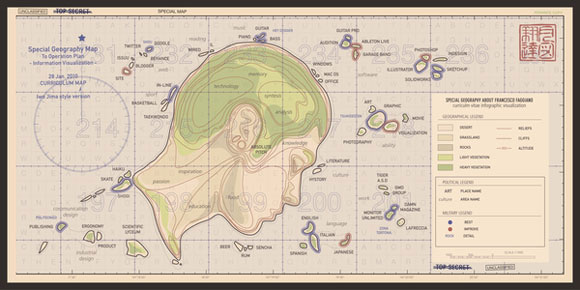
Personal Data
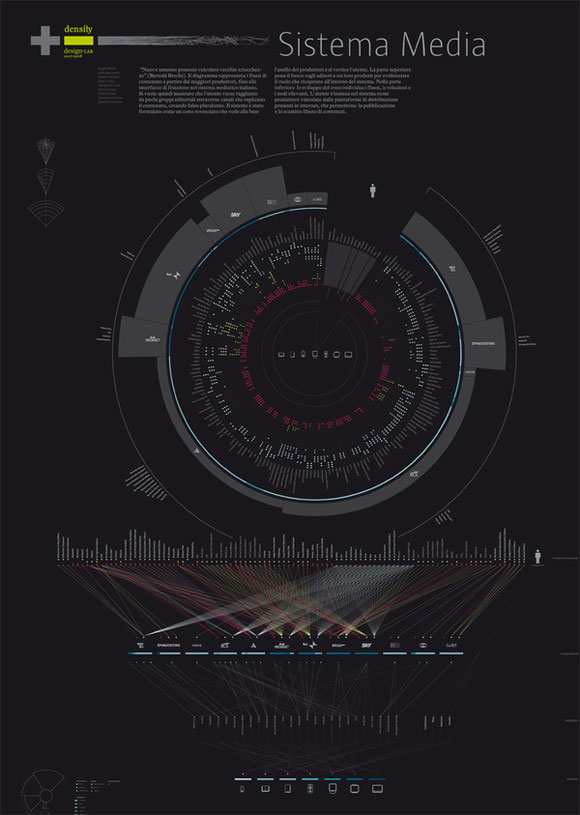
Italian Media System in 2008
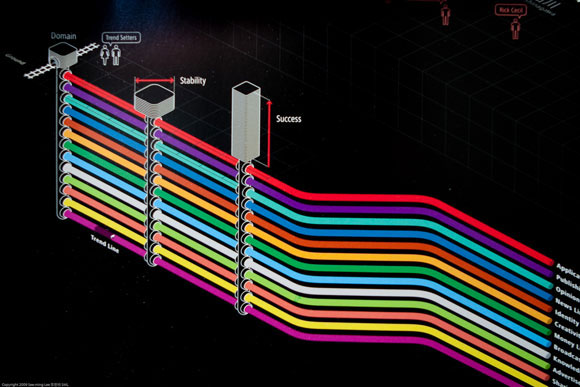
Web Trend Map
Flickr on the Web

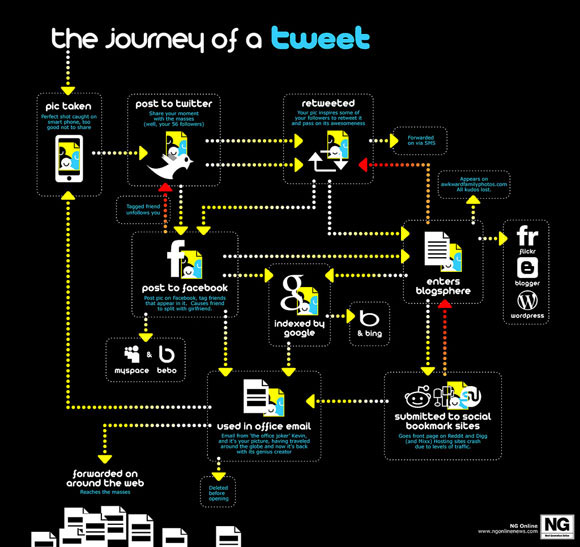
The journey of Tweet
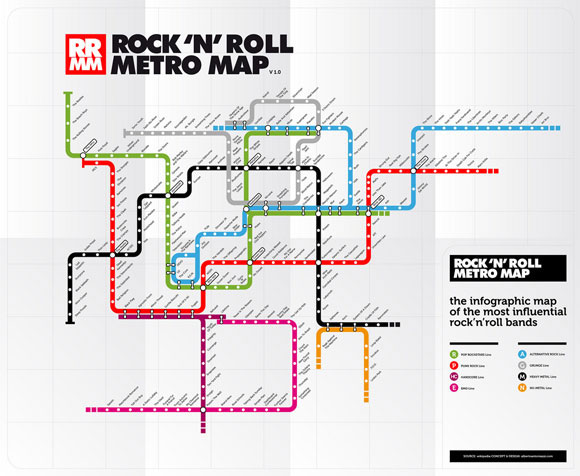
Rock ‘N’ Roll Metro
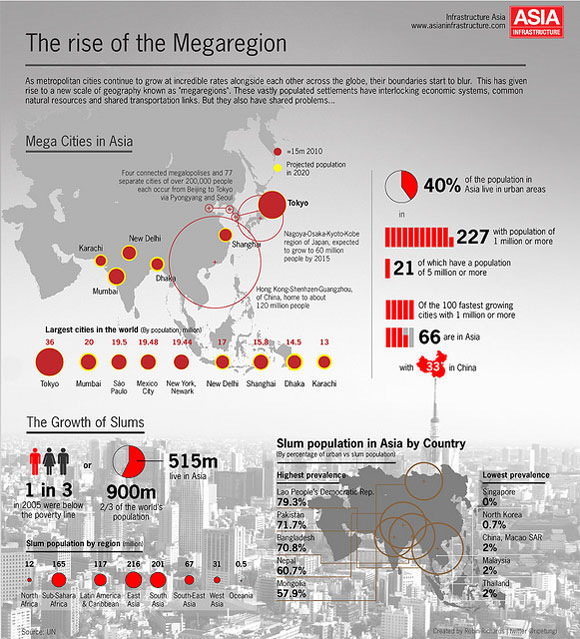
ASIA Mega Regions
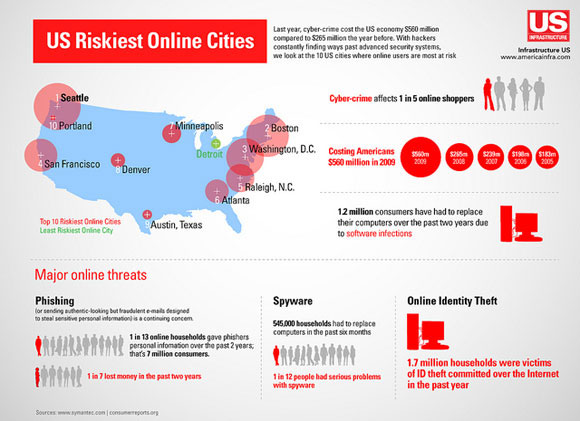
Rickiest US online cities
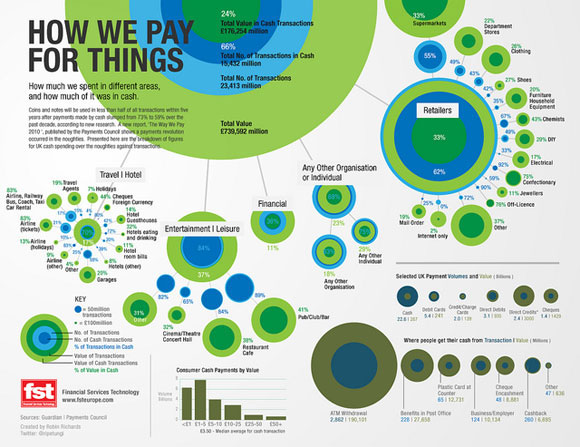
UK Spending
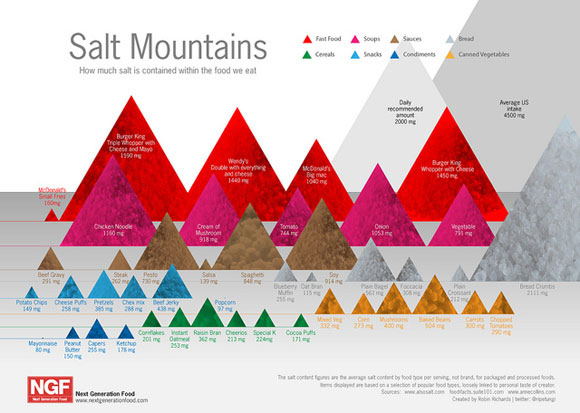
Salt Mountains
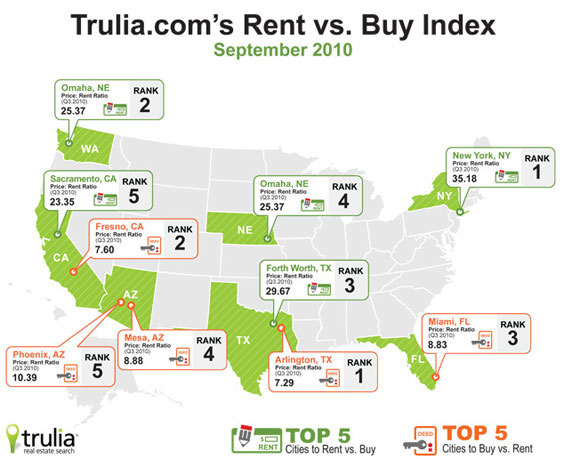
Trulia.com Rent vs. Buy
Small Scale (energy) Harvesting

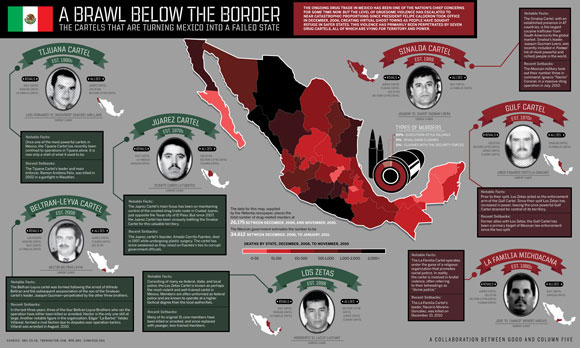
Who’s Who in the Mexican Drug Wars
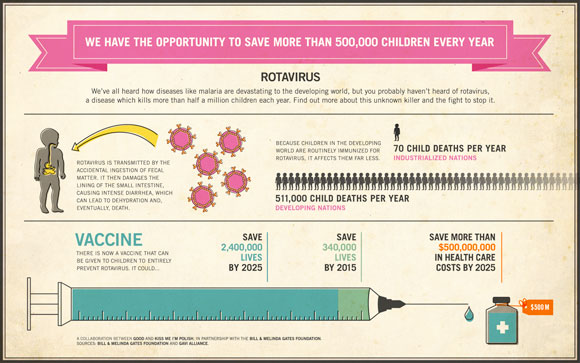
Rotavirus: The Killer Disease You’ve Never Heard Of Can Be Easily Stopped
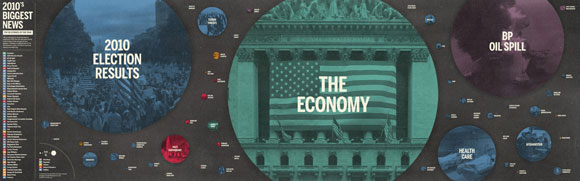
The Biggest News Stories of 2010
Being Fat Will Literally Kill You

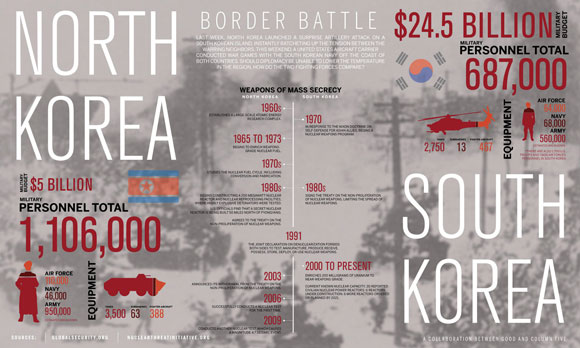
Which Korea Has the Bigger Army?
Share